
The agent returned a plausible answer, but nobody can explain why it queried one tool, repeated another, or stopped before finishing. The log contains the final text. The failure is hidden in the path that disappeared.
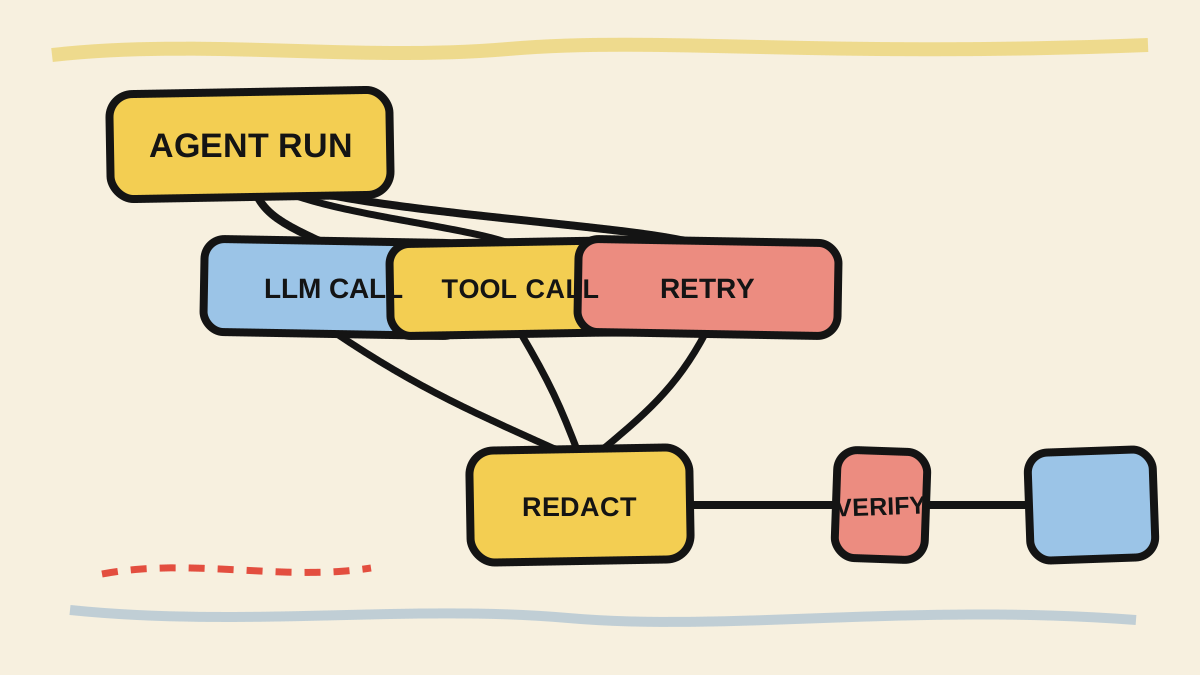
A useful trace treats an agent run as a tree. A root span represents the run. Child spans represent model calls, retrieval, tool calls, retries, and checks. That lets you find the step that was slow, failed, or changed state without turning the entire conversation into a log.
This article shows a small TypeScript boundary for that record. The example is illustrative: it was not run against an agent or an observability backend. Current OpenTelemetry guidance describes a GenAI trace with invoke_agent, chat, and execute_tool spans, while OpenInference defines categories such as AGENT, LLM, and TOOL on top of OpenTelemetry transport (OpenInference, "Traces").

Short answer
- Create a root span for each agent run and a child span for each operation worth diagnosing.
- Propagate the active span context into the function that executes the tool.
- Record the name, ID, duration, attempt, and summarized outcome. Do not copy arguments, prompts, or responses by default.
- Treat validation, tracing, and checkpointing as different jobs: telemetry explains the path, but it does not resume a run.
Why does a model log not explain an agent?
A model call is only one part of a run. The model may request a tool, receive a result, choose another tool, and try again after a timeout. If each step goes to a separate log, a reviewer has to reconstruct the order by timestamp and may still miss the relationship between the decision and the effect.
OpenTelemetry describes traces as a way to record related operations. Parent-child relationships carry the execution structure. For an agent, that means the run can be the parent of a model call, while a tool call appears as an operation inside the same cycle.
This model also keeps the scope honest. The conversation a user saw is a product record. The trace is an operational record. They can share a runId without storing the same content. A recent practitioner discussion recommends separating the conversation from the execution trace, keeping IDs, latency, cost, errors, and summarized outcomes in the trace (r/AI_Agents). That is community language, not an OpenTelemetry requirement, but it is a useful design boundary.
Start by naming the questions a reviewer must answer. Which run failed? Which tool call happened? Which attempt was repeated? Which step was still active? If the answer does not require the full text, do not put the full text in the span.
What should an AI agent span tree look like?
Start with a span that represents the agent run. Inside it, create spans for operations that change the diagnosis: model calls, tool selection, tool execution, data access, retries, and validation. Not every small helper needs a span. Instrumenting every function creates noise and makes the important failure harder to find.
A minimal tree can look like this:
agent.run
├── model.chat
├── tool.execute: search_orders
│   └── http.client
├── model.chat
└── tool.execute: update_order
    └── database.client
Span names can follow your runtime's vocabulary. The important part is consistent hierarchy and attributes. OpenTelemetry's GenAI page lists attributes for the model, tokens, messages, tool name, and tool-call ID. The page also says those attributes moved to a dedicated repository and appear as development or deprecated in the older registry view (OpenTelemetry, "Gen AI attributes"). Treat GenAI names as a versioned contract, not permanent strings.
OpenInference supplies another useful taxonomy when the backend understands its conventions. A tool operation is TOOL, a model call is LLM, and the span grouping them can be AGENT (OpenInference, "Traces"). You can adopt that taxonomy without abandoning OTLP. Do not mix a vendor's names with undocumented attributes, though.
How do you instrument a tool call in TypeScript?
The wrapper should open the span inside the run context, mark an error when the function fails, and close the span in finally. The code below is a short illustration. It uses local outcome and attempt attributes, and records the tool-call ID without storing the full payload.
import {
  SpanStatusCode,
  trace,
} from "@opentelemetry/api";

const tracer = trace.getTracer("agent-runtime");

type ToolInput = {
  name: string;
  callId: string;
  attempt: number;
};

export async function executeTool<T>(
  input: ToolInput,
  run: () => Promise<T>,
): Promise<T> {
  return tracer.startActiveSpan(
    `tool.execute:${input.name}`,
    {
      attributes: {
        "gen_ai.tool.name": input.name,
        "gen_ai.tool.call.id": input.callId,
        "agent.tool.attempt": input.attempt,
      },
    },
    async (span) => {
      try {
        const result = await run();
        span.setAttribute("agent.tool.outcome", "success");
        return result;
      } catch (error) {
        span.setAttribute("agent.tool.outcome", "error");
        span.recordException(error as Error);
        span.setStatus({
          code: SpanStatusCode.ERROR,
          message: error instanceof Error ? error.message : "unknown error",
        });
        throw error;
      } finally {
        span.end();
      }
    },
  );
}
The important part is not the name executeTool. It is the active context. startActiveSpan makes the current span available while run() waits for a response. If run() creates an instrumented HTTP client, the network span can become a child. If the runtime loses context when entering a queue, callback, or worker, the trace breaks into separate trees.
The OpenTelemetry Node.js guide shows SDK initialization and warns that instrumentation must load before the code it should observe. For ESM and TypeScript compiled to ESM, initialization must also follow the loader guidance in the documentation. A correct wrapper cannot compensate for an SDK that was never initialized.
This example does not validate arguments, decide whether a tool is safe, or implement retries. The TypeScript tool-call validation contract remains the boundary that decides whether an action may start. The trace records what happened after that decision.
Which attributes belong in the trace?
Record attributes that help you filter and compare runs. The exact set depends on your backend, but these fields are a reasonable starting point:
| Field | Example | Why keep it |
|---|---|---|
agent.run.id |
run_8f2 |
links spans to the run record |
gen_ai.agent.name |
order-assistant |
separates agents in the same service |
gen_ai.tool.name |
search_orders |
filters the failing tool |
gen_ai.tool.call.id |
call_42 |
correlates request and result |
agent.tool.attempt |
2 |
reveals retries and loops |
agent.tool.outcome |
success |
counts failures without reading payloads |
error.type |
TimeoutError |
groups an operational cause |
OpenTelemetry defines attributes as typed key-value pairs. Prefer low-cardinality values for recurring filters. A run ID can help investigate one occurrence, but it can be expensive as a metric dimension. Do not turn every customer argument into a metric label.
Size matters too. A trace should answer a diagnostic question, not mirror the prompt. Keep a tool name and a resource identifier when policy allows it. For large payloads, store a redacted artifact separately and put only an access-controlled reference in the span. That reference must not let every trace reader discover customer data.
How do you keep telemetry from leaking secrets?
Start with an exclusion policy. System prompts, user messages, tool arguments, external responses, and headers can contain secrets or personal data. The fact that a convention offers an attribute for messages does not require your application to fill it.
A simple policy has three layers:
- Always allowed: service name, version, environment, tool name, error type, duration, and categorized outcome.
- Allowed after reduction: internal IDs, payload size, status code, irreversible hash, and a redacted sample.
- Blocked by default: tokens, cookies, full prompts, personal data, financial arguments, and unclassified tool responses.
Redact before the exporter. Redacting only in the backend UI leaves data exposed during transport, retention, and administrative access. Test exceptions too: an error message can contain the original argument, and recordException can carry sensitive text if the application does not normalize it.
OpenInference explains that AI applications have privacy requirements and support field masking. Use that concern as a design input, not as a claim that a library solves your policy. The backend receives what your instrumentation process sends.
How do you verify that the trace tells the right story?
Do not stop at a green span in a dashboard. Create a controlled scenario in which the agent runs a known tool, force an error, and make a second attempt. Then check that the tree keeps the same trace, the second attempt remains a child of the run, and the error appears on the correct tool.
A short checklist helps:
- Does the run have a root span that starts before the first model call?
- Does every tool call have a name, ID, and attempt number?
- Does tool execution remain a child of the run after an
await? - Does the error include status and an exception without a secret?
- Does a retry create a new span instead of overwriting the first attempt?
- Does a slow tool expose the HTTP client or database that delayed it?
- Does the trace contain only the minimum reference needed for investigation?
Test what should be missing as well. Run a tool with a sensitive argument and confirm that the exporter receives a redacted version or no payload. Interrupt the call before it returns and confirm that the span ends with an error or cancellation. If the trace is correct only on the happy path, it is not yet proof of useful observability.
The coding-agent observability owner explains how to turn agent events into evidence a reviewer can consume. Here the unit is smaller: the span should locate the step worth investigating before you decide which evidence belongs in CI.
When the question changes from "what happened?" to "did the trajectory follow the contract?", use spans as input for testing an AI agent's trajectory. The trace supplies events; the test decides which ones were allowed.
Trace, log, metric, or checkpoint?
They answer different questions. A trace explains order and relationships. A log keeps textual event detail. A metric aggregates counts and latency for alerts. A checkpoint stores enough state to resume a run. An agent system may need all four.
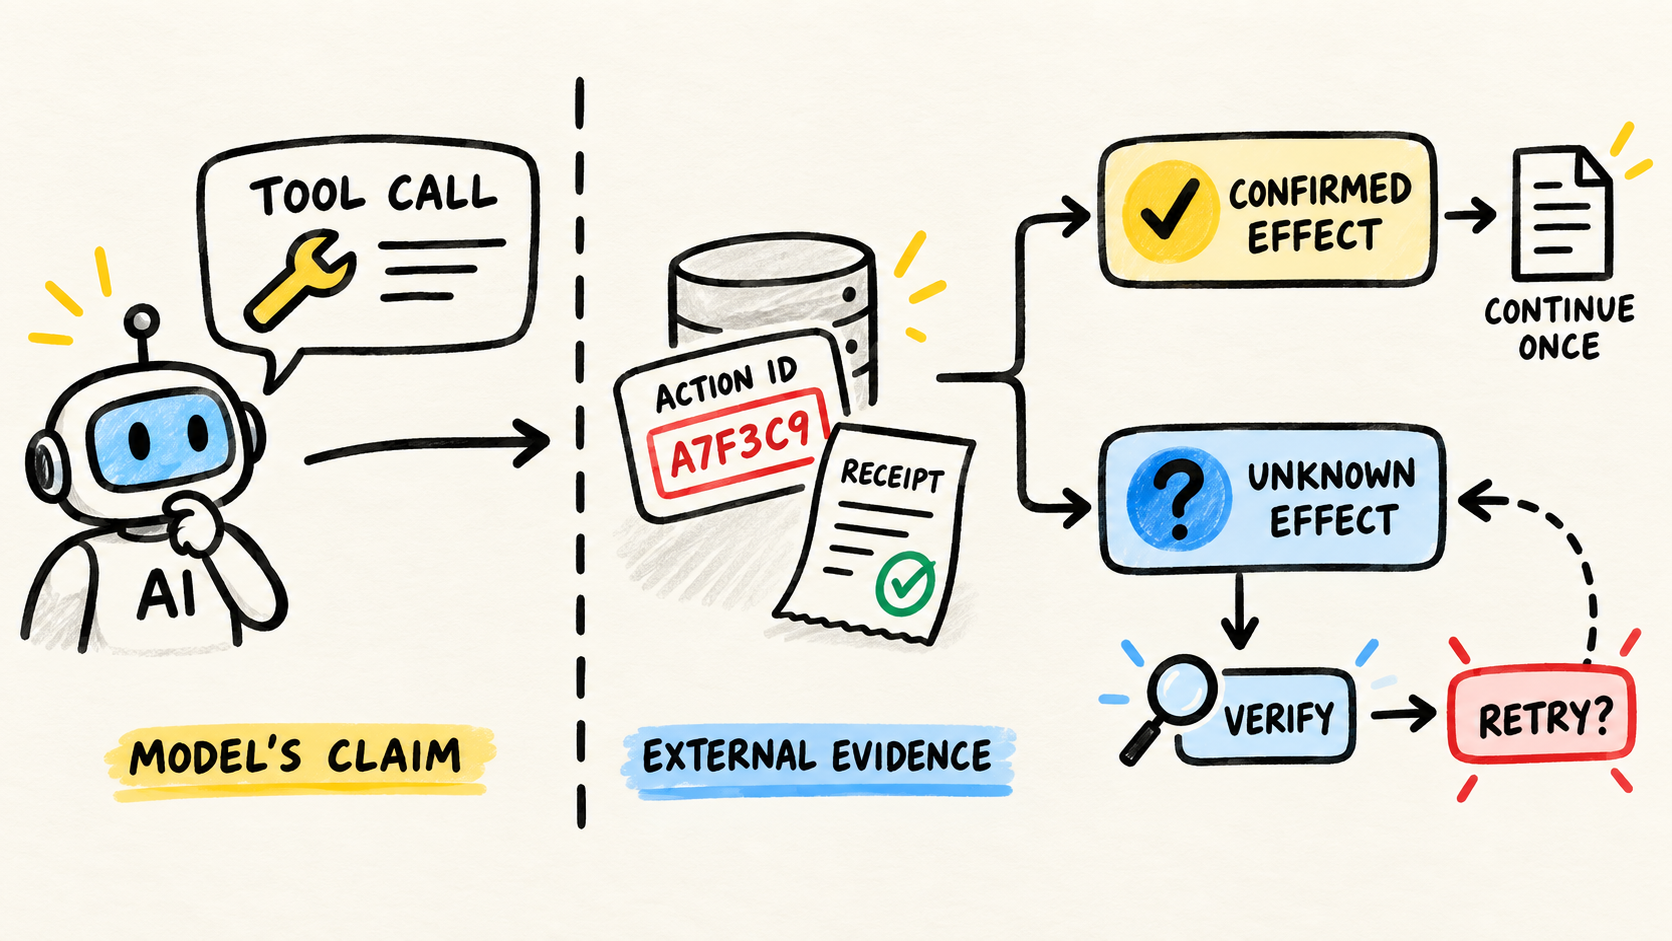
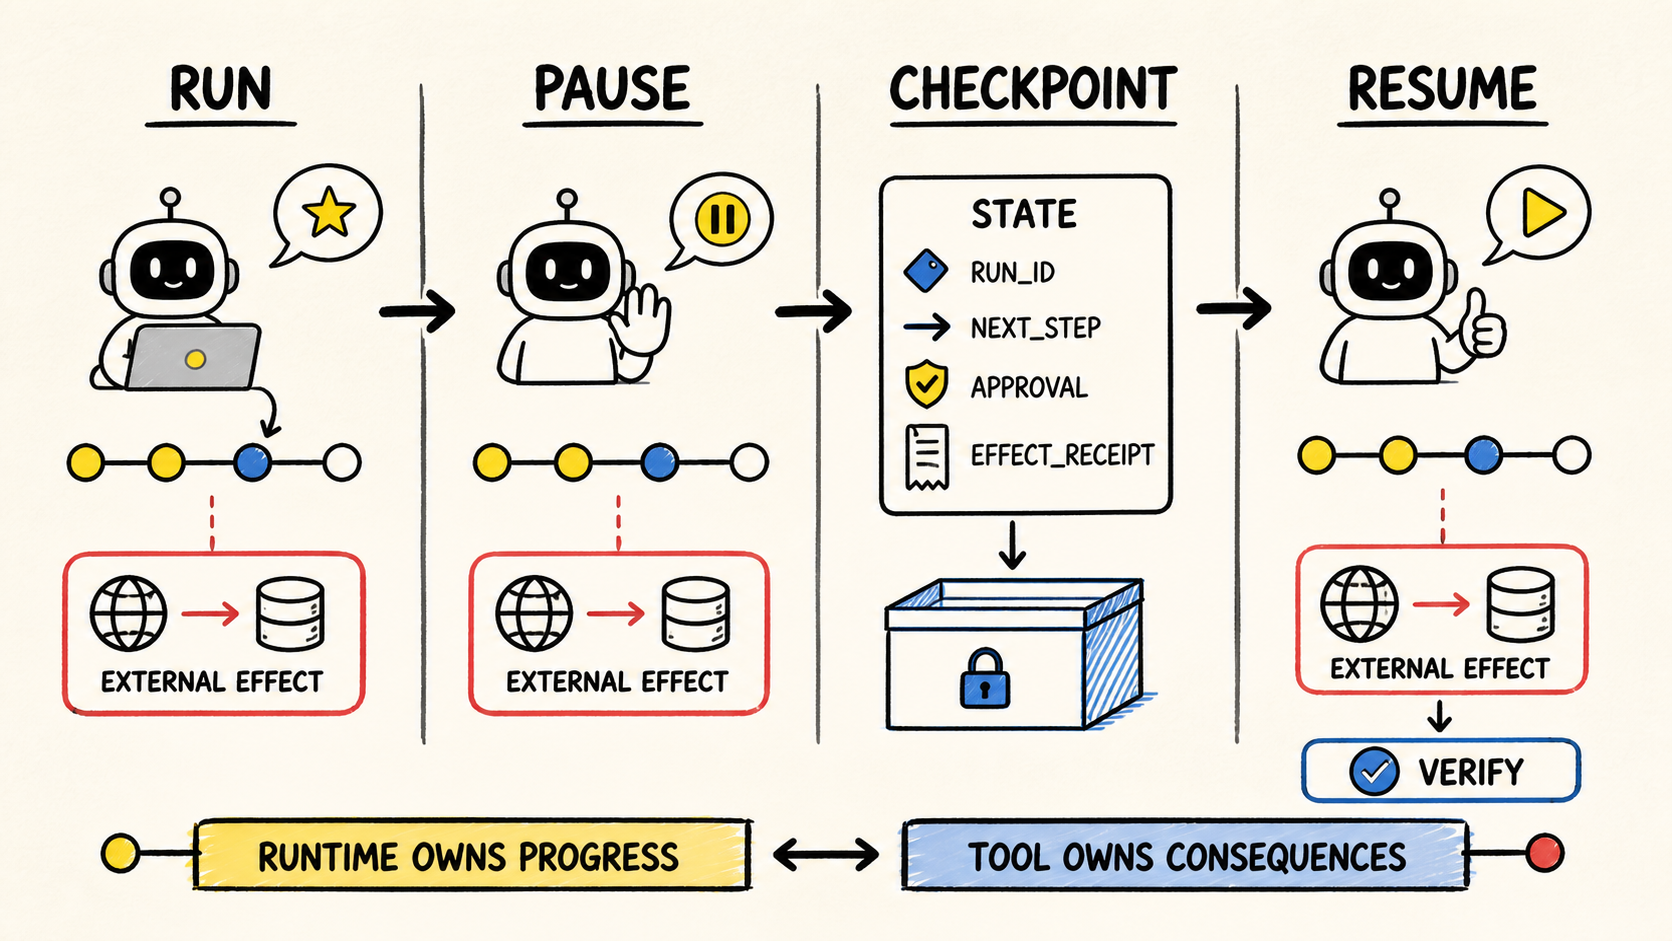
Do not use a trace as a state database. An exporter may delay, sample, drop, or retain data for a short period. If the agent must continue after a process dies, persist state and each step's contract outside telemetry. The article on durable execution for AI agents covers that decision.
Do not use plain text logs as a substitute for hierarchy either. JSONL with every event can help with audit, but without parent context, stable IDs, and duration it becomes a list someone must sort by hand. The trace supplies the structure. Logs and artifacts can complete the story.
Frequently asked questions
Do I need to record the full prompt to debug an agent?
No. Start with agent name, model, tool call, IDs, attempt, duration, error, and categorized outcome. OpenTelemetry offers attributes for messages and tool calls, but the application decides what to export. Use redacted samples or protected references only when the data policy allows them.
Does every tool call need a span?
Every call you need to investigate deserves an observable operation, but not every internal helper needs a span. Start with the run, model, tool, retrieval, retry, and external dependency. If the tree becomes noisy, remove mechanical spans after preserving the boundary that explains the decision.
Does OpenTelemetry replace an AI agent observability product?
No. OpenTelemetry provides APIs, SDKs, context, and transport for telemetry. A backend may add search, visualization, and agent-specific alerts. OpenInference adds conventions for agent, model, and tool spans. The backend choice does not remove the need to define what is safe to record.
Can a trace resume an agent after a failure?
Not by itself. A trace shows what was observed and can help locate the last step. Resuming requires persisted state, idempotency, a retry policy, and a decision about which step may be repeated. Treat the trace as execution evidence, not as a reliable checkpoint.
Conclusion
An observable agent is not the one that produces the most logs. It is the one that leaves a short trail showing which step ran, which tool was called, which attempt failed, and what can safely be shared.
Start with a root run span. Nest model calls and tools. Propagate context across async work. Record IDs, duration, attempt, status, and error. Then test failures, retries, and sensitive arguments. OpenTelemetry can carry the structure, but the quality of the trace depends on the contract you write around it.
How this analysis was done
Samuel Fajreldines is the accountable author. The research compared current OpenTelemetry and OpenInference documentation, the existing observability cluster, and recent public practitioner discussions. The span tree and redaction checklist are original editorial synthesis. The TypeScript wrapper is illustrative and was not run against an agent or backend. AI assistance supported discovery, drafting, image generation, localization, and consistency review. It did not provide production experience or replace source verification. The author also maintains RemoteCode as a work tool.
Sources consulted
- OpenTelemetry, "Inside the LLM Call: GenAI Observability with OpenTelemetry", retrieved 2026-09-24
- OpenTelemetry, "Gen AI attributes", retrieved 2026-09-24
- OpenTelemetry, "Node.js getting started", retrieved 2026-09-24
- OpenTelemetry, "Traces", retrieved 2026-09-24
- OpenTelemetry, "Semantic conventions", retrieved 2026-09-24
- OpenInference, "Traces", retrieved 2026-09-24
- OpenInference, "OpenInference specification", retrieved 2026-09-24
- OpenInference, "OpenInference JS", retrieved 2026-09-24